What is with the Horrible Wait times???

whatfun

Earning My Ears
Joined
Jun 26, 2015
I have an upcoming trip to Disney World and have been checking the My Disney App watching wait times.
It seems stand by wait times have been just awful!
Especially for all the popular rides. Regardless of the time of day.

What is causing all the wait times to be so High?
Is it a Capacity issue? Really Crowded?

It has been a few years since I was at Disney World due to COVID.
And I can't ever remember wait times being so High for the rides. Even with the changes of Fast Pass and Genie +.

I am not talking about Slinky, Rise or Flights of Passage, just the others.

Yesterday Everest, Navi, Jungle Cruise, Big Thunder, Pirates, etc. all had wait times of 60 minutes + continuously throughout the day.
Some rides 85-150 minutes????

Just ridiculous in my opinion.

How can Disney expect people to stand in lines that long for most of the rides? You will NEVER get much done or be able to ride very much.

Don't they see they have a HUGE issue?

Are the parks currently that crowded? Even in February?

Wow!

I am not sure what to think for my upcoming May trip.

Any feed back would be appreciated.

Thanks!
 
I suggest making friends with the Here Now and Just Back thread here. This will give you people’s actual experiences recently, and over the next couple months, and help you better plan your trip. Some use G+/ILL, some don’t. Some rope drop, some don’t. You’ll get multiple takes on different park strategies.

Fwiw there really isn’t a slow time at WDW anymore. It’s Busy, Really Busy, or What The Heck Was I Thinking?! Busy. The way to avoid being that person waiting an hour for Everest is to do your research and planning ahead of time and the DIS is a great place for that!
 
It's a combination of the parks being crowded, ride capacity (some rides have lower capacity than others due to the load/unload process and the ride vehicle type - ex. boats like Jungle Cruise, Navi, Pirates and Frozen), demand for certain attractions and Genie+. CMs have a ratio of standby to Genie+/ILL people that they let into the queue and that can drastically increase wait times. This ratio existed when Fastpass+ was around as well. When my sister worked at MK, the ratio she was instructed to follow was 10 Fastpass+ for every 1 standby but when a ride comes back up from being down or during super crowded times, I've seen the entire Lightning lane line cleared out before CMs let in a single standby party. That could be like....50 to 100 LL to 1 standby.
 
Posted ride times are not actual wait times. I'd take a look at thrill data for wait time data, as well as touring plans lines app, if you have it, to see real, anticipated wait times. I stalk MDE and Lines before trips to get a general idea but between weather issues, rides being down, random park happenings, LL/G+; what the parks look like one day in MDE may be vastly different the next day. And again, MDE is not actual wait times, it's disney's expected wait times which imo are usually inflated so they don't over promise and under deliver.

Also, yes the parks are busy in February. I think there are northern school districts that have winter breaks and President's day weekend is coming up which is a high crowd time of year. Last year, February pretty much almost broke Genie plus and guests had awful, awful experiences. Last February's crowds were unheard of and while I don't think disney's expecting what they had last year, it will be crowded over the next week or so.
 
Unfortunately what you are seeing is quite normal for the majority of the year. Lines are normally shorter the first couple of hours of the day and the last couple of hours in the evening but during the prime of the day, I would be prepared for long waits. Disney is popular and there are not a lot of quieter times.

There are attractions with shorter waits but the most popular will either require G+ or a wait in standby line.
 
We just got back from a trip last week. Just want to add that we saw the same wait times, and while we mostly rope-dropped and used LLs and ILLs, the few times that we did decide to wait, the posted wait times were wildly inaccurate. Usually at least double what we actually waited...

A few of our examples:
7 Dwarfs: Posted 65 mins, actual 25 mins
Tower of Terror: Posted 75 mins, actual 25 mins
Mickey and Minnie's: Posted 60 mins, actual 20 mins

Not sure if this was just us but what they had posted just wasn't accurate for us at all. It was interesting to watch the times change. You can blatantly tell Disney is trying to push people towards certain rides/shows.
 
I have an upcoming trip to Disney World and have been checking the My Disney App watching wait times.
It seems stand by wait times have been just awful!
Especially for all the popular rides. Regardless of the time of day.

What is causing all the wait times to be so High?
Is it a Capacity issue? Really Crowded?

It has been a few years since I was at Disney World due to COVID.
And I can't ever remember wait times being so High for the rides. Even with the changes of Fast Pass and Genie +.

I am not talking about Slinky, Rise or Flights of Passage, just the others.

Yesterday Everest, Navi, Jungle Cruise, Big Thunder, Pirates, etc. all had wait times of 60 minutes + continuously throughout the day.
Some rides 85-150 minutes????

Just ridiculous in my opinion.

How can Disney expect people to stand in lines that long for most of the rides? You will NEVER get much done or be able to ride very much.

Don't they see they have a HUGE issue?

Are the parks currently that crowded? Even in February?

Wow!

I am not sure what to think for my upcoming May trip.

Any feed back would be appreciated.

Thanks!
A lot of kids have off varios times this week because of Presidents Day & Lincoln's Birthday, so this is a high crowd time.
 
It has been a few years since I was at Disney World
That's probably the most important factor. Don't get me wrong, what you're describing does sound a bit off. We visited around MLK and Everest was a near walk-on (though, yes, the big rides like Slinky, 7DMT, FoP etc did get above 2 hours. We rode 7DMT at park close with a wait of ca 45'.). But 2023 WDW simply isn't the same as 2019 WDW—though we mustn't overlook the fact that even 2019 wasn't 2017. I won't attempt to be an expert explaining why, but my perception is that there's simply more attendance, period.

But don't put too much stock in one moment's snapshot via MDE; dig more into the data at thrill-data.com and compare accross weeks. And shut your eyes this weekend as Mardi Gras, marathons, and more converge. (In fact, maybe you're already seeing some of that travel?)
 
We just got back from a trip last week. Just want to add that we saw the same wait times, and while we mostly rope-dropped and used LLs and ILLs, the few times that we did decide to wait, the posted wait times were wildly inaccurate. Usually at least double what we actually waited...

A few of our examples:
7 Dwarfs: Posted 65 mins, actual 25 mins
Tower of Terror: Posted 75 mins, actual 25 mins
Mickey and Minnie's: Posted 60 mins, actual 20 mins

Not sure if this was just us but what they had posted just wasn't accurate for us at all. It was interesting to watch the times change. You can blatantly tell Disney is trying to push people towards certain rides/shows.

This was very similar to what we experienced last March. Aside from one out of control wait for the safari we consistently found stand by lines to be 50-60% of the posted wait time. Its almost like they started inflating it to deal with unknowns from genie+? or pushing them up to try to drive up genie+ purchases...
 
Touring plans utilizes on the ground data. I've regularly submitted my wait times while at the parks. I have no idea how thrill data gathers their info but given it's retrospective, it's pretty accurate. I presume they have some boots on the ground as does TP.
That's not correct, I would say that user data is barely used in the actual wait calculation. Both touring plans and thrill data use an algorithm to predict wait times. Neither one is going to tell you exactly how they do it for obvious reasons but to say its real time data is just not true.

For example yesterday touring plans calculated 153 user provided wait times for the entire day for seven dwarfs mine train with a ride capacity of 16000 people(on a bad day) that's .009% used to calculate actual wait times. At that point the user data is useless and there algorithm was predicting wait times throughout the day.

Touring Plans uses 2 different wait times to calculate their expected wait: historical WDW reported times and actually seen wait times. For historical wait times that they report, they compare actually seen wait times to their expected. The actually seen wait times are gathered through the Lines app and the many TP employees who actually watch and count the waits at attractions.
 
Touring plans utilizes on the ground data. I've regularly submitted my wait times while at the parks. I have no idea how thrill data gathers their info but given it's retrospective, it's pretty accurate. I presume they have some boots on the ground as does TP.
The problem is your submitted wait time is not accurate either. Assuming we're talking about a ride with a sizable wait - which is really when wait times become relevant - by the time you've submitted your wait it is out of date by however long you waited. Submitting a 60 minute wait time means that 60 minutes ago the wait was 60 minutes . . . doesn't help too much for those getting on line 60 minutes later. Disney's posted wait times for the vast majority of the day are fairly accurate barring a ride encountering difficulties. Thrill data is basically sweeping the posted wait times so you shouldn't see much difference in the aggregate from what is posted. People tend to remember the times that waits were off and barely notice when they're mostly accurate.

[The exception being the very beginning of the day when ride times fluctuate wildly very quickly and end of day when they drop off significantly as well.]
 
Touring Plans uses 2 different wait times to calculate their expected wait: historical WDW reported times and actually seen wait times. For historical wait times that they report, they compare actually seen wait times to their expected. The actually seen wait times are gathered through the Lines app and the many TP employees who actually watch and count the waits at attractions.
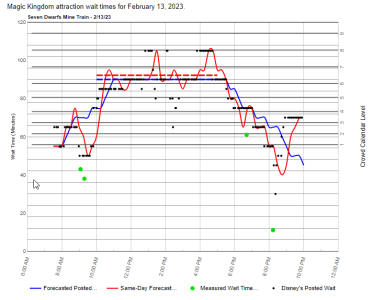
Almost no one is using the lines app to log wait times and why would you hire people to monitor wait times when you can get them thru an API? That would be a complete waste of money. Touring plan employs a data scientist to write there algorithms and being a data scientist myself there's no way only 2 data points are being used. If you look at the graph throughout the day touring plans is spot on in some cases are pretty far off on others but on avg there pretty close at least for this ride on this day.

The purple is what they predicted ahead of time and the red is what there algorithm predicted thru out the day which is always auto correcting itself based on updated information. All in all I would say this ride for the day was a success on touring plans.

The green is the user added wait times which almost no one is using

1676409120850.png
 
Almost no one is using the lines app to log wait times and why would you hire people to monitor wait times when you can get them thru an API? That would be a complete waste of money. Touring plan employs a data scientist to write there algorithms and being a data scientist myself there's no way only 2 data points are being used. If you look at the graph throughout the day touring plans is spot on in some cases are pretty far off on others but on avg there pretty close at least for this ride on this day.

The purple is what they predicted ahead of time and the red is what there algorithm predicted thru out the day which is always auto correcting itself based on updated information. All in all I would say this ride for the day was a success on touring plans.

The green is the user added wait times which almost no one is using

View attachment 739660

I know they have data scientist(s) , and most stuff is algorithm based. However, Len Testa has said they have people in the parks counting. He has even said that he counts sometimes.
 

GET A DISNEY VACATION QUOTE

Dreams Unlimited Travel is committed to providing you with the very best vacation planning experience possible. Our Vacation Planners are experts and will share their honest advice to help you have a magical vacation.

Let us help you with your next Disney Vacation!


facebook twitter
Top